Contradiction radar
Finds where the numbers and the people disagree.
Scores, comments and interviews, read against each other. The finding a survey platform can't see.
Continuous Organizational Insight
The diagnostic operating system for consulting firms. Brief, survey, fieldwork and boardroom readout in one flow, on your methodology and under your brand.
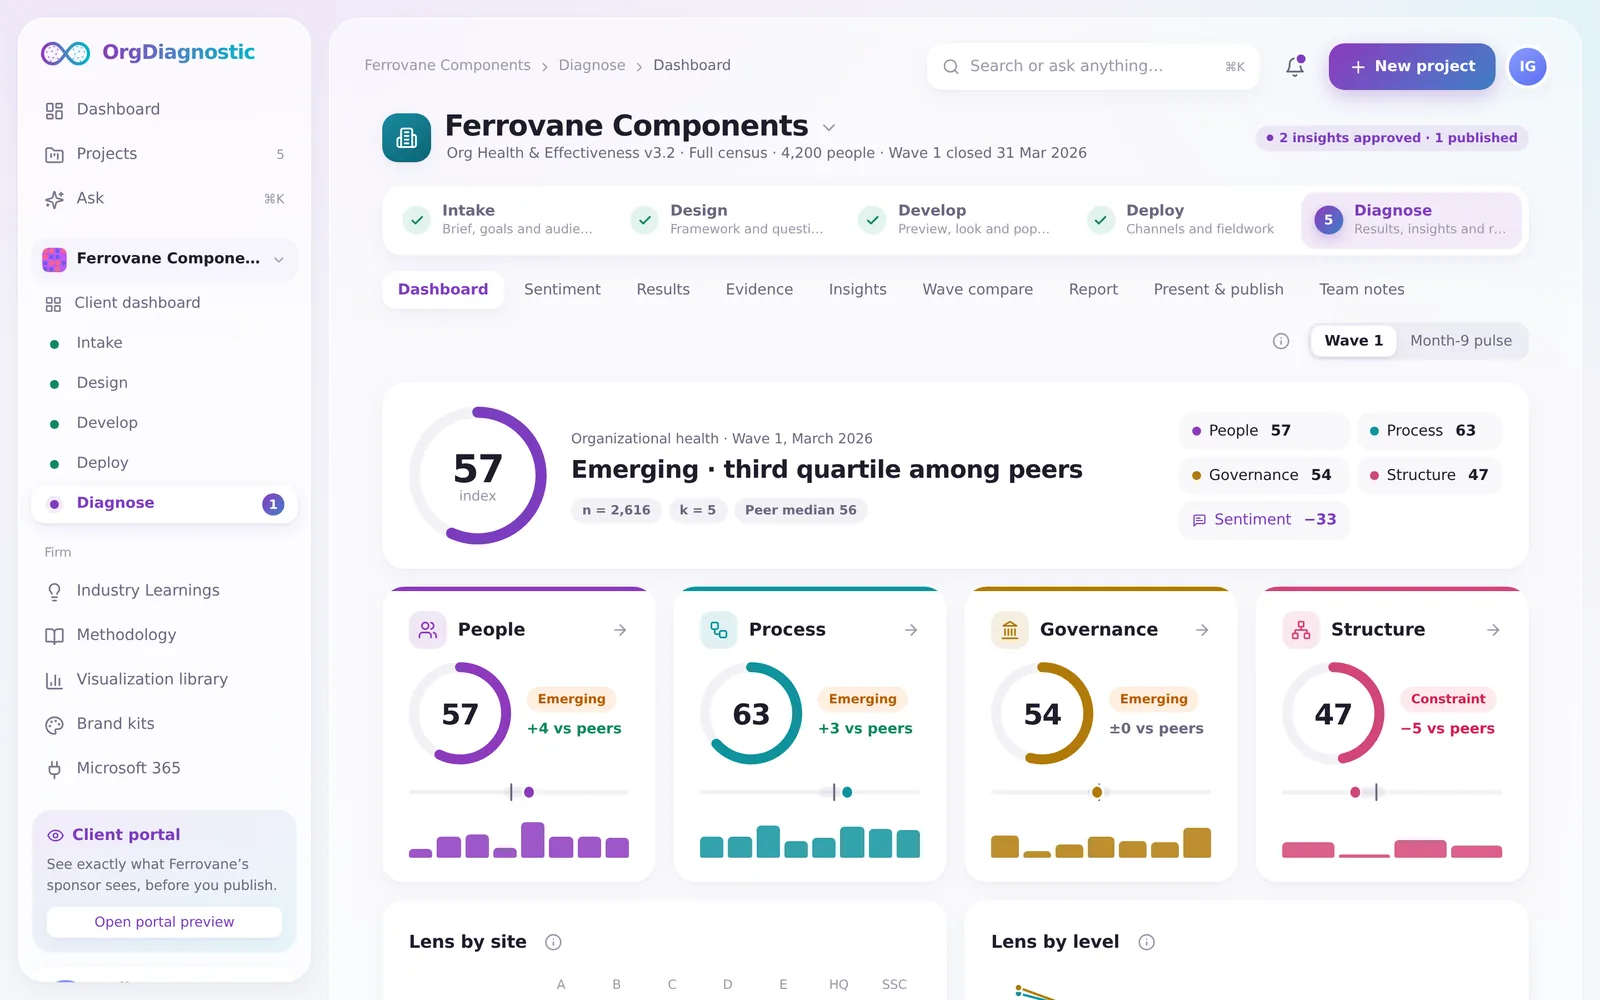
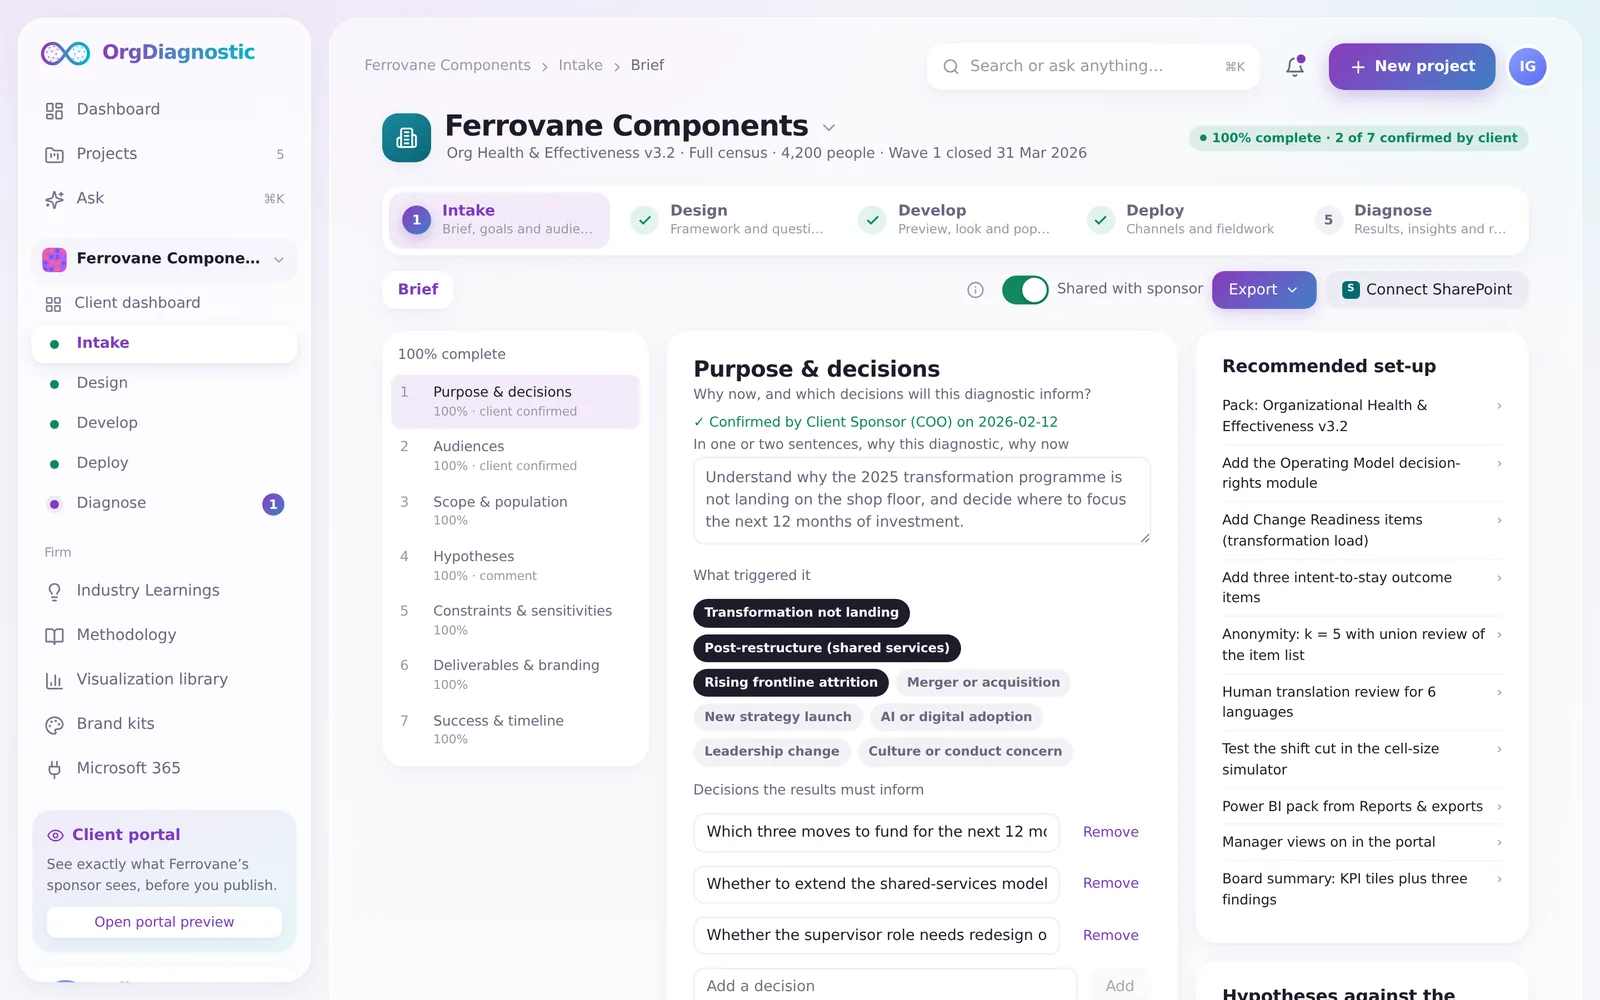
One flow
Goals, audience, decisions and hypotheses, captured once and carried all the way to the readout.
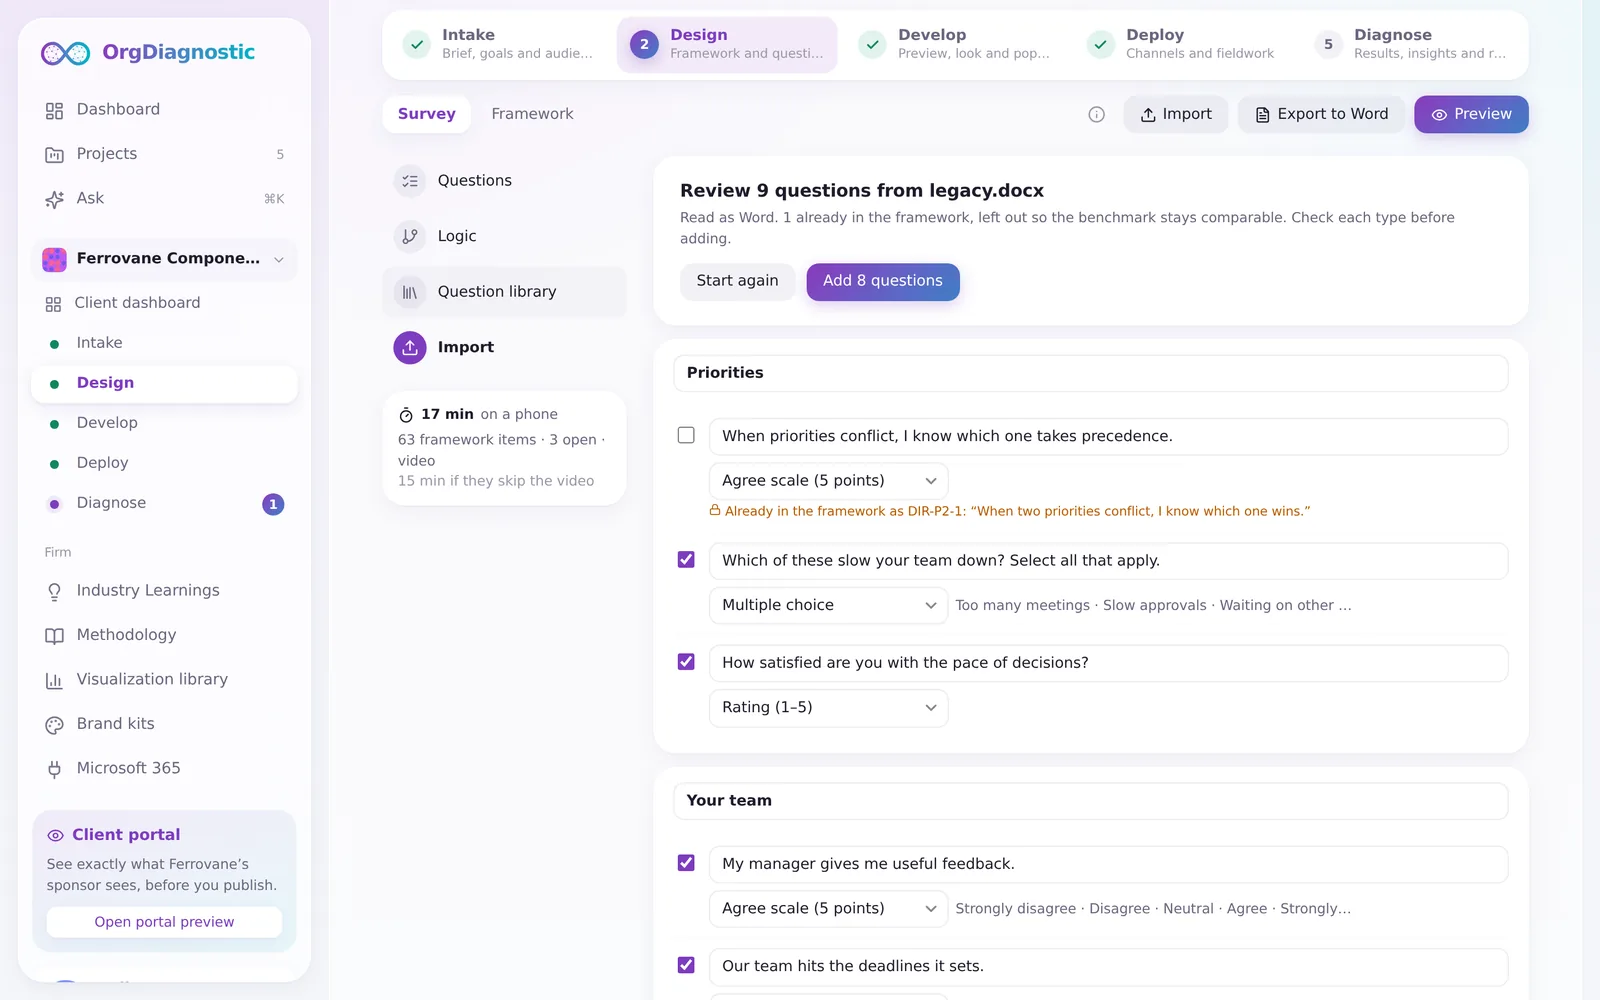
Build on your versioned framework, or import last year's survey and map every question to it.
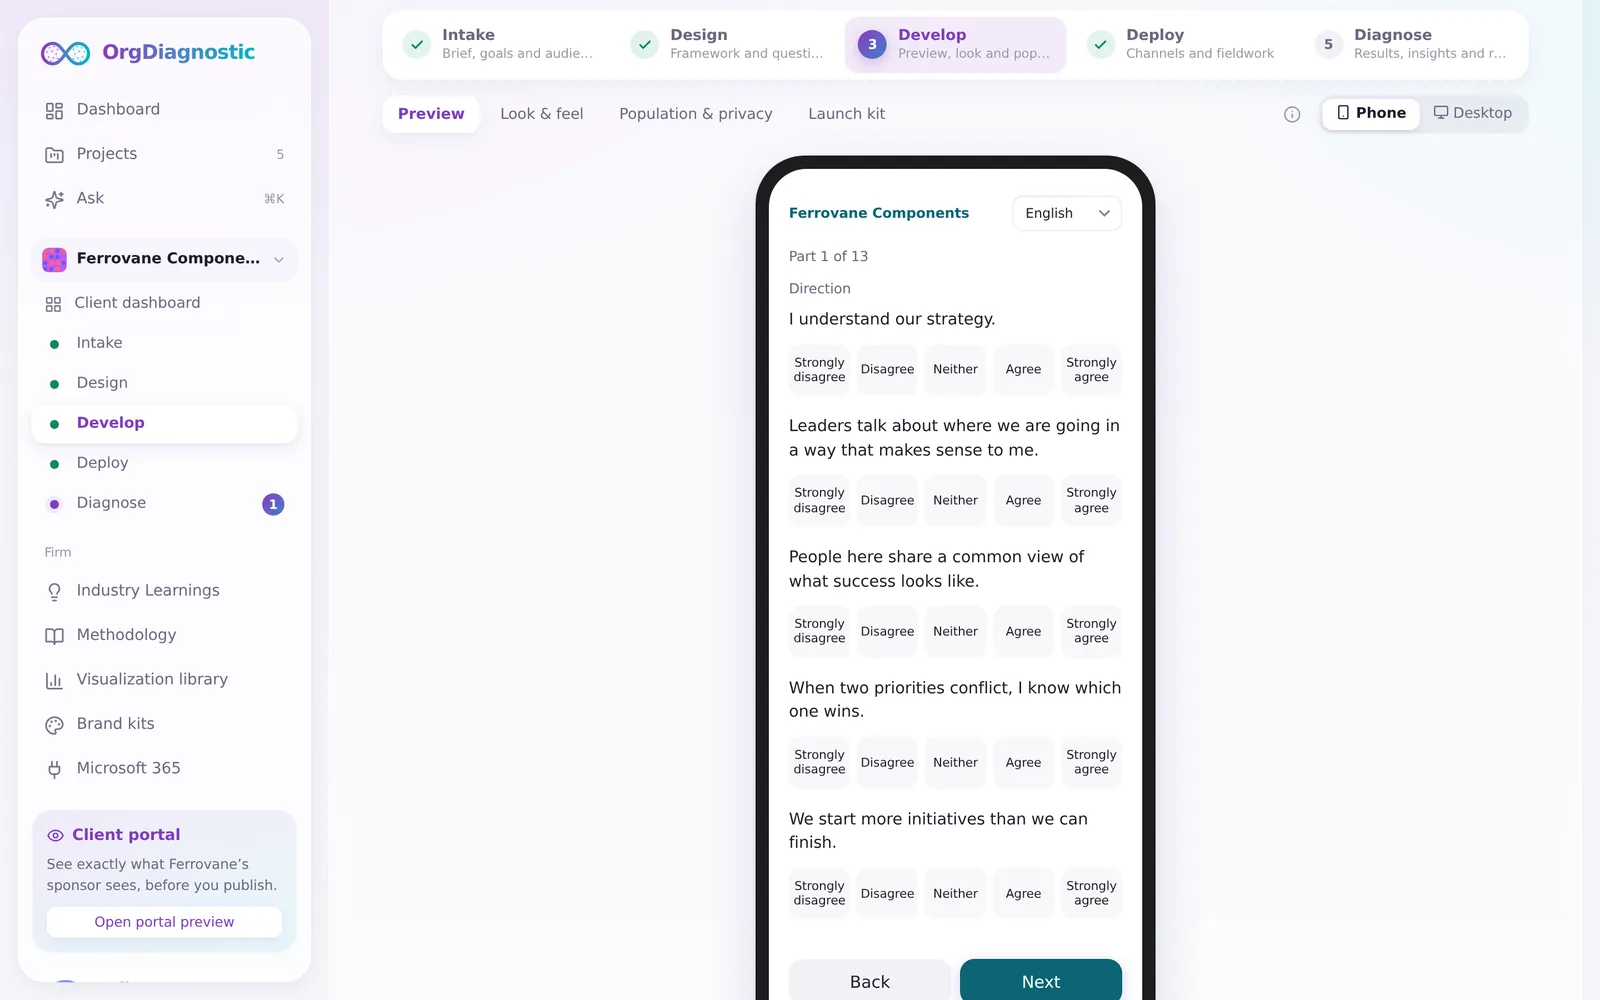
See exactly what every respondent sees, on a phone or a desk, before a single invite goes out.
Launch through Outlook and Teams, then steer fieldwork by group and by day.
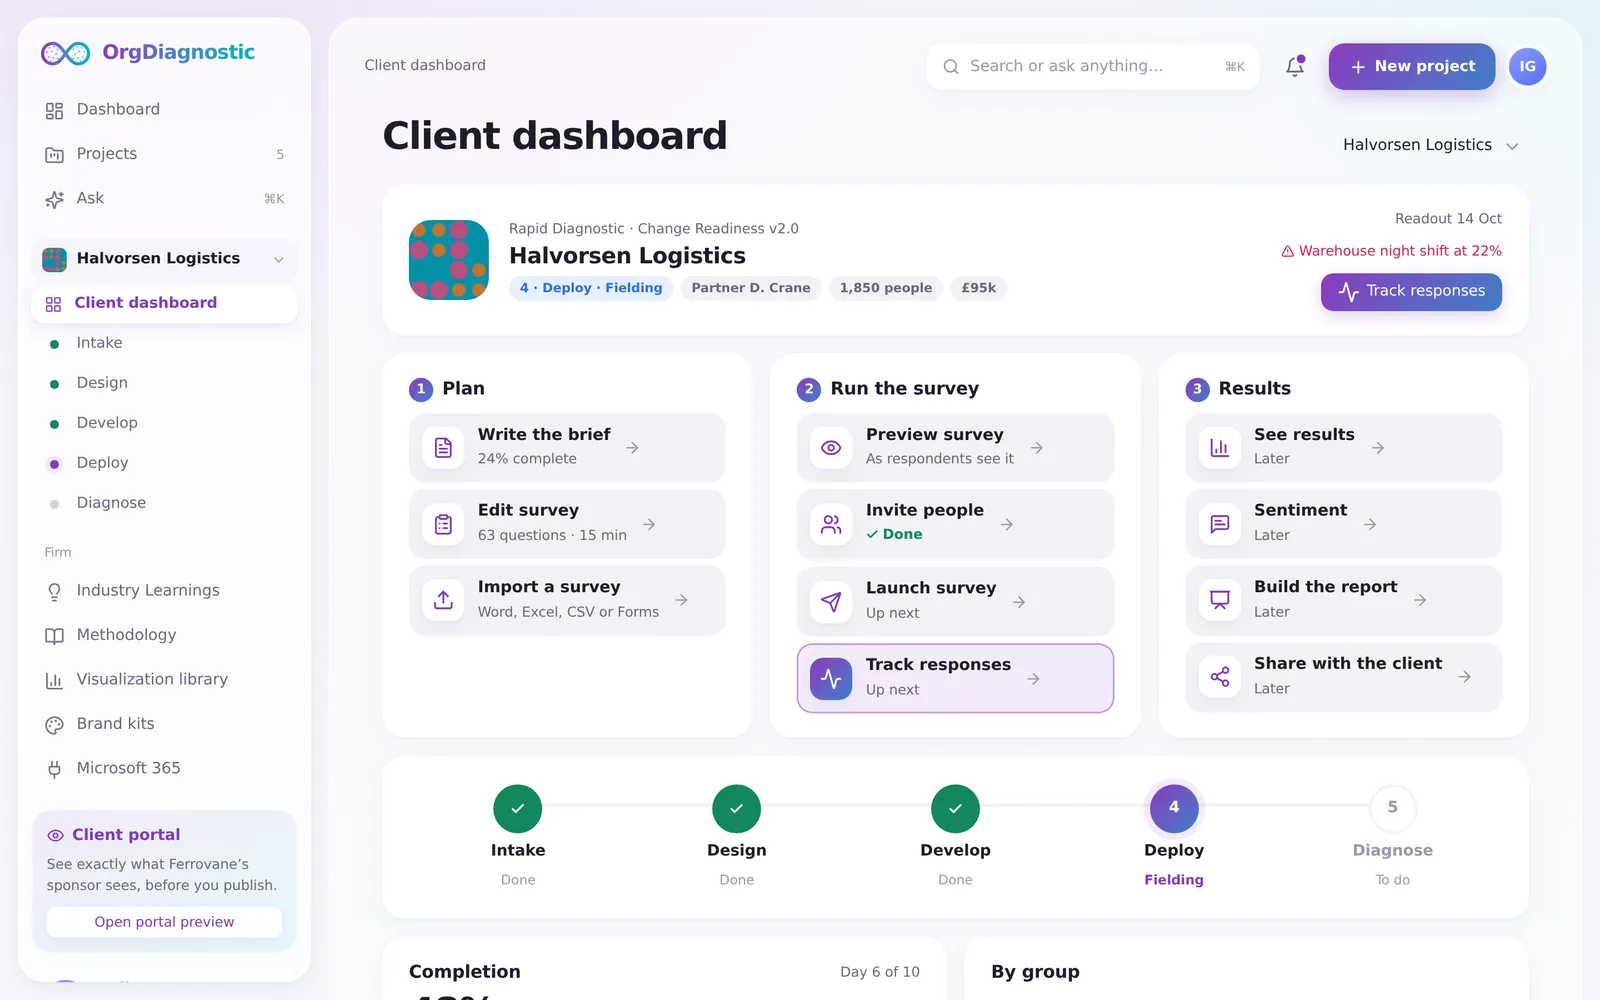
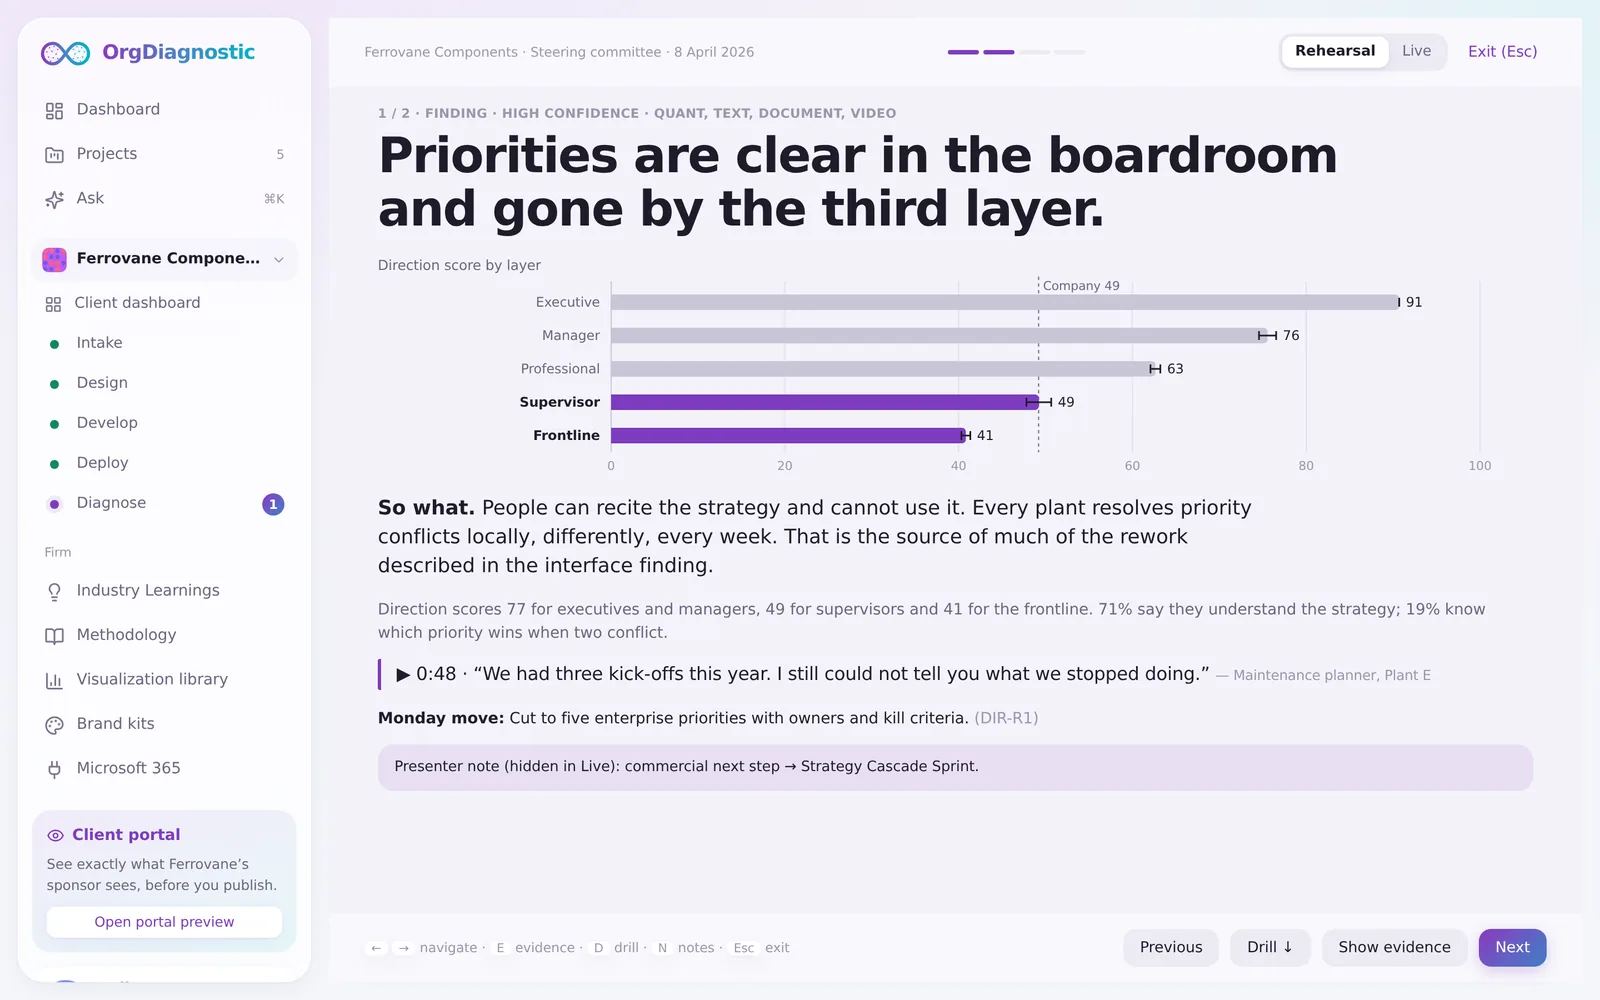
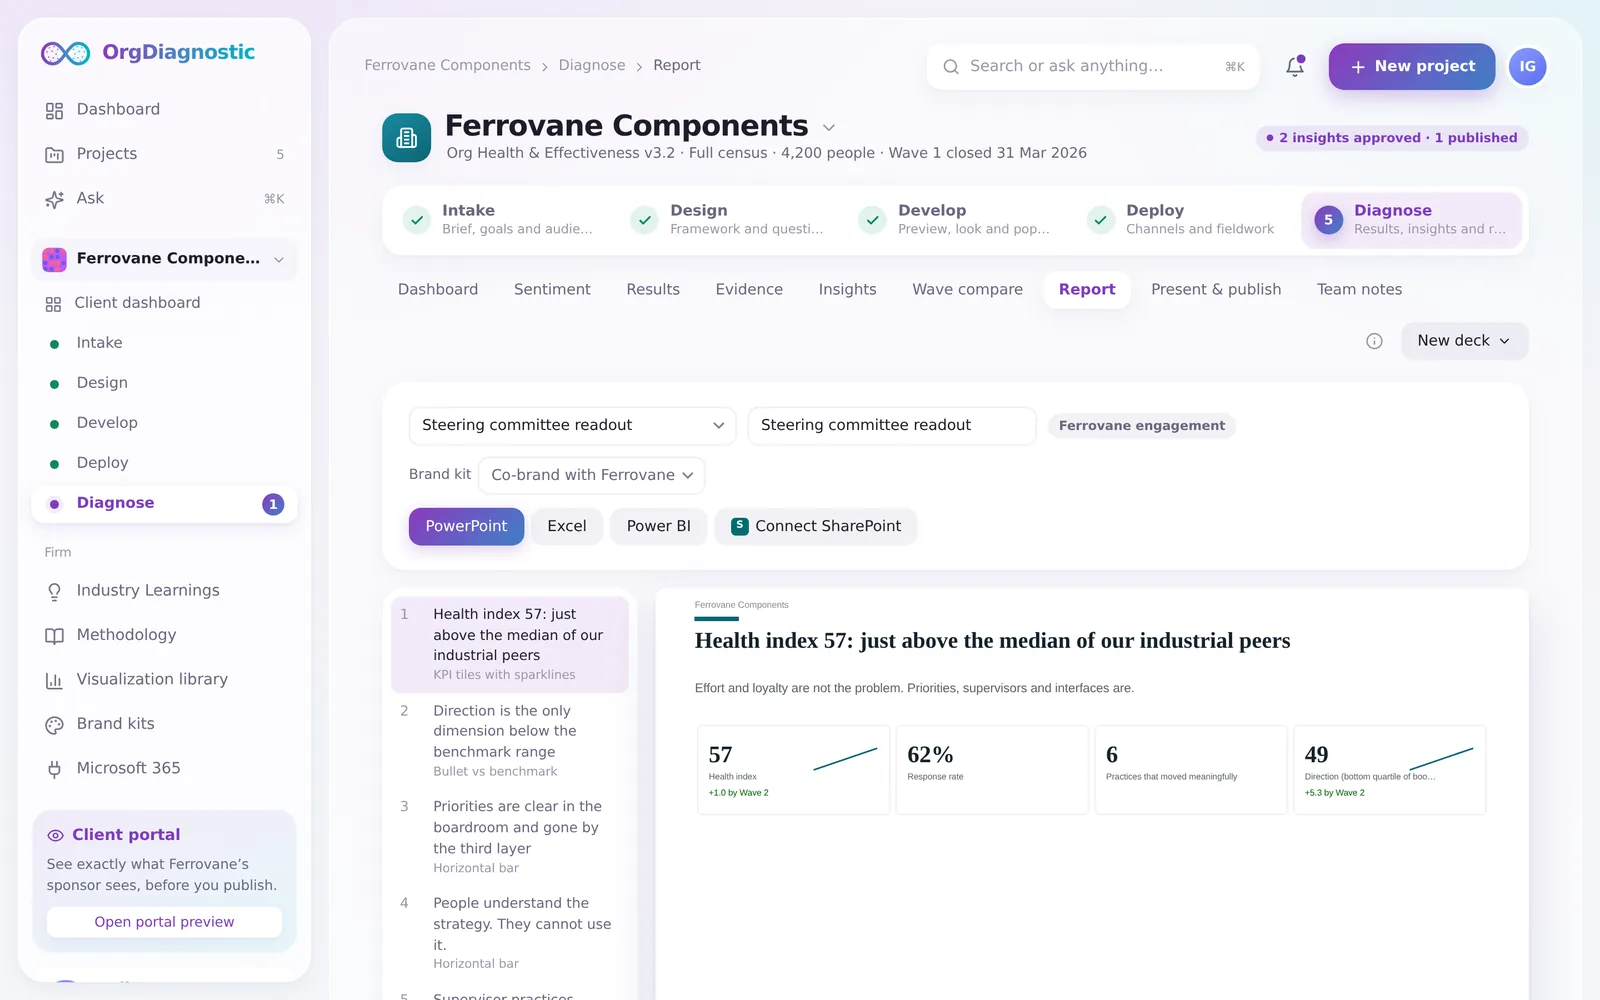
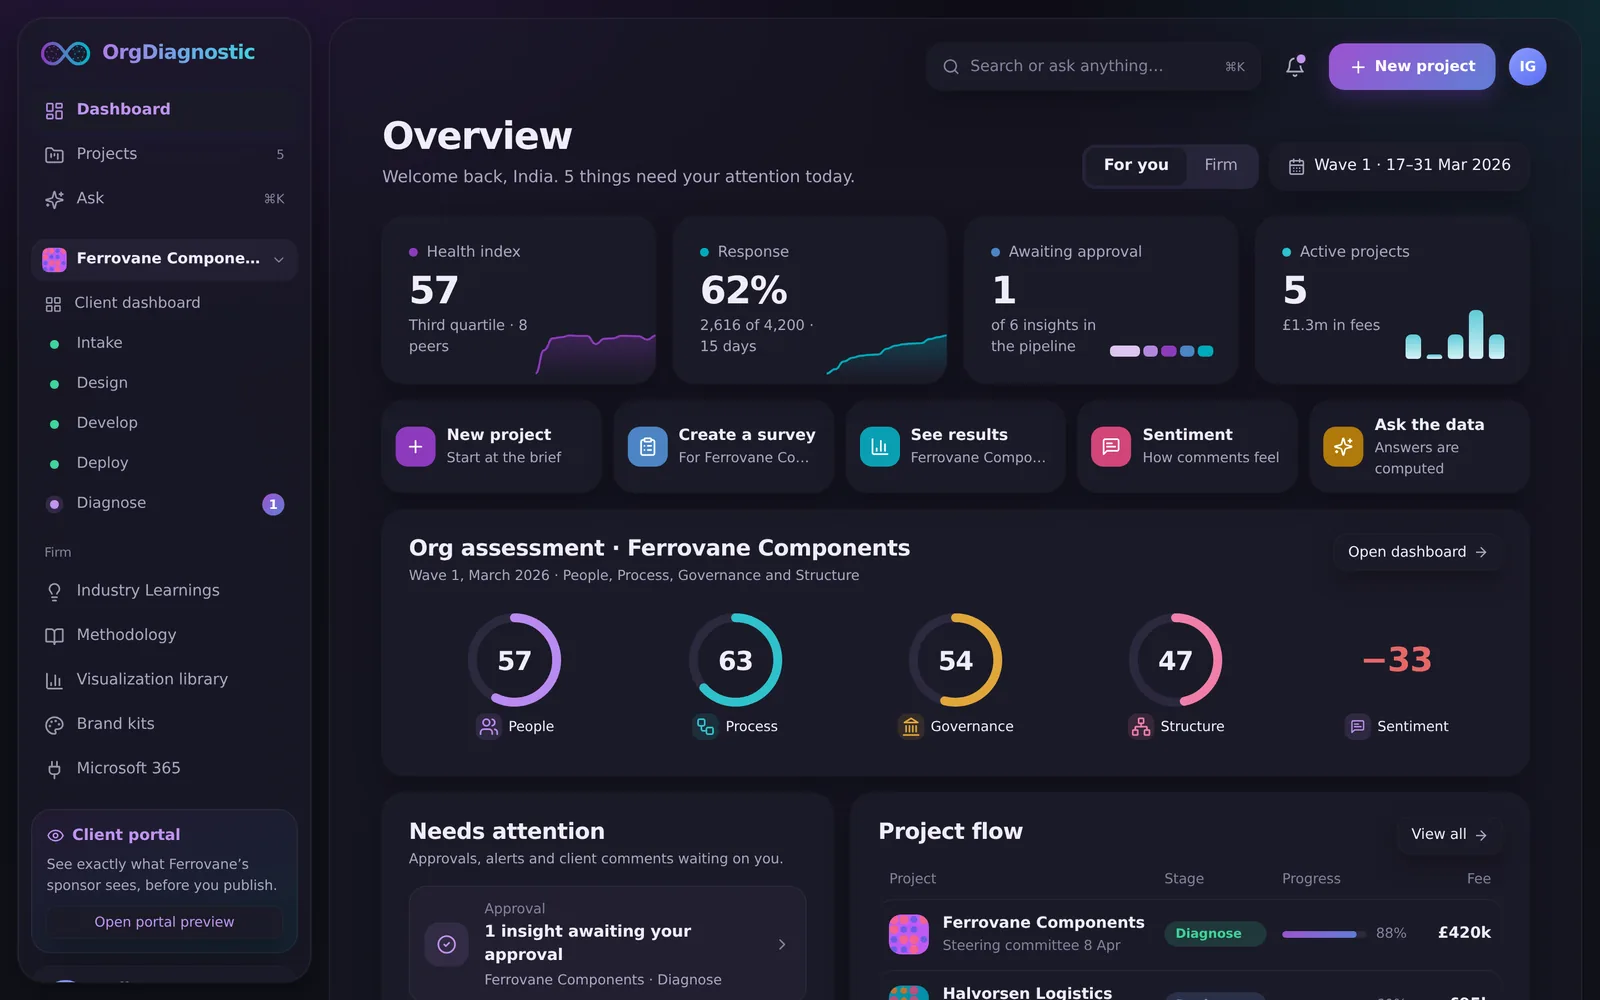
An overall index, four lenses, and a deep dive behind every tile. Then present it live.
See it move
Recorded in the live prototype.
Only in OrgDiagnostic
Engagement platforms measure. Slide decks persuade. OrgDiagnostic does the diagnosis in between, and shows its working.
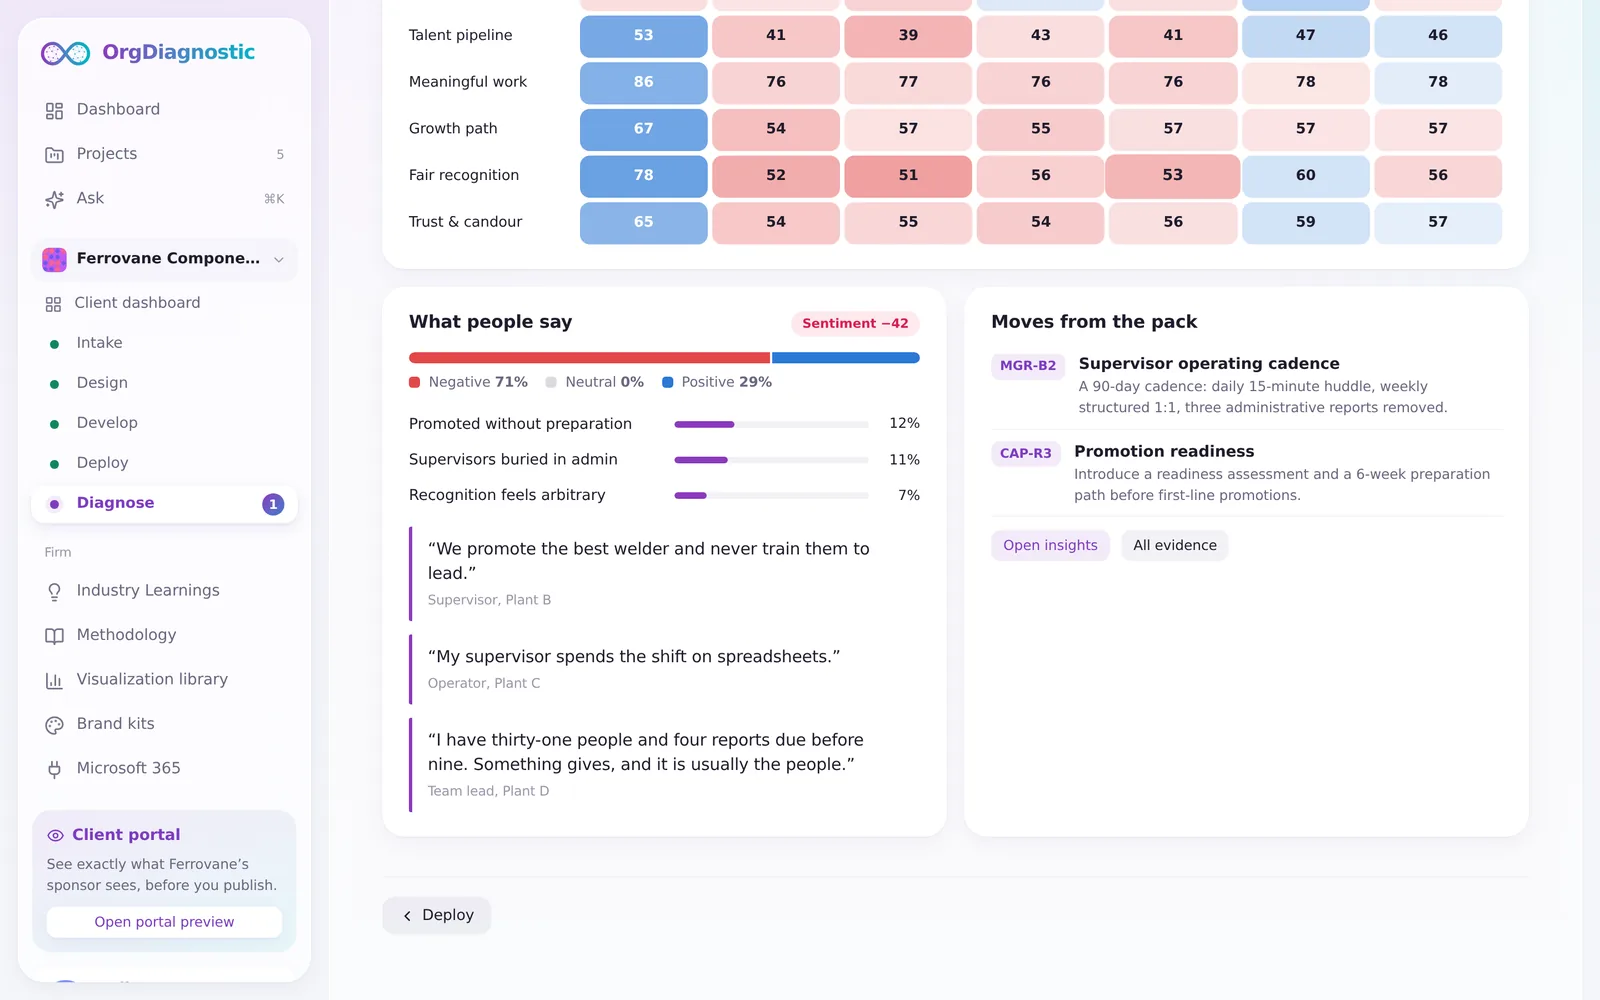
Scores, comments and interviews, read against each other. The finding a survey platform can't see.
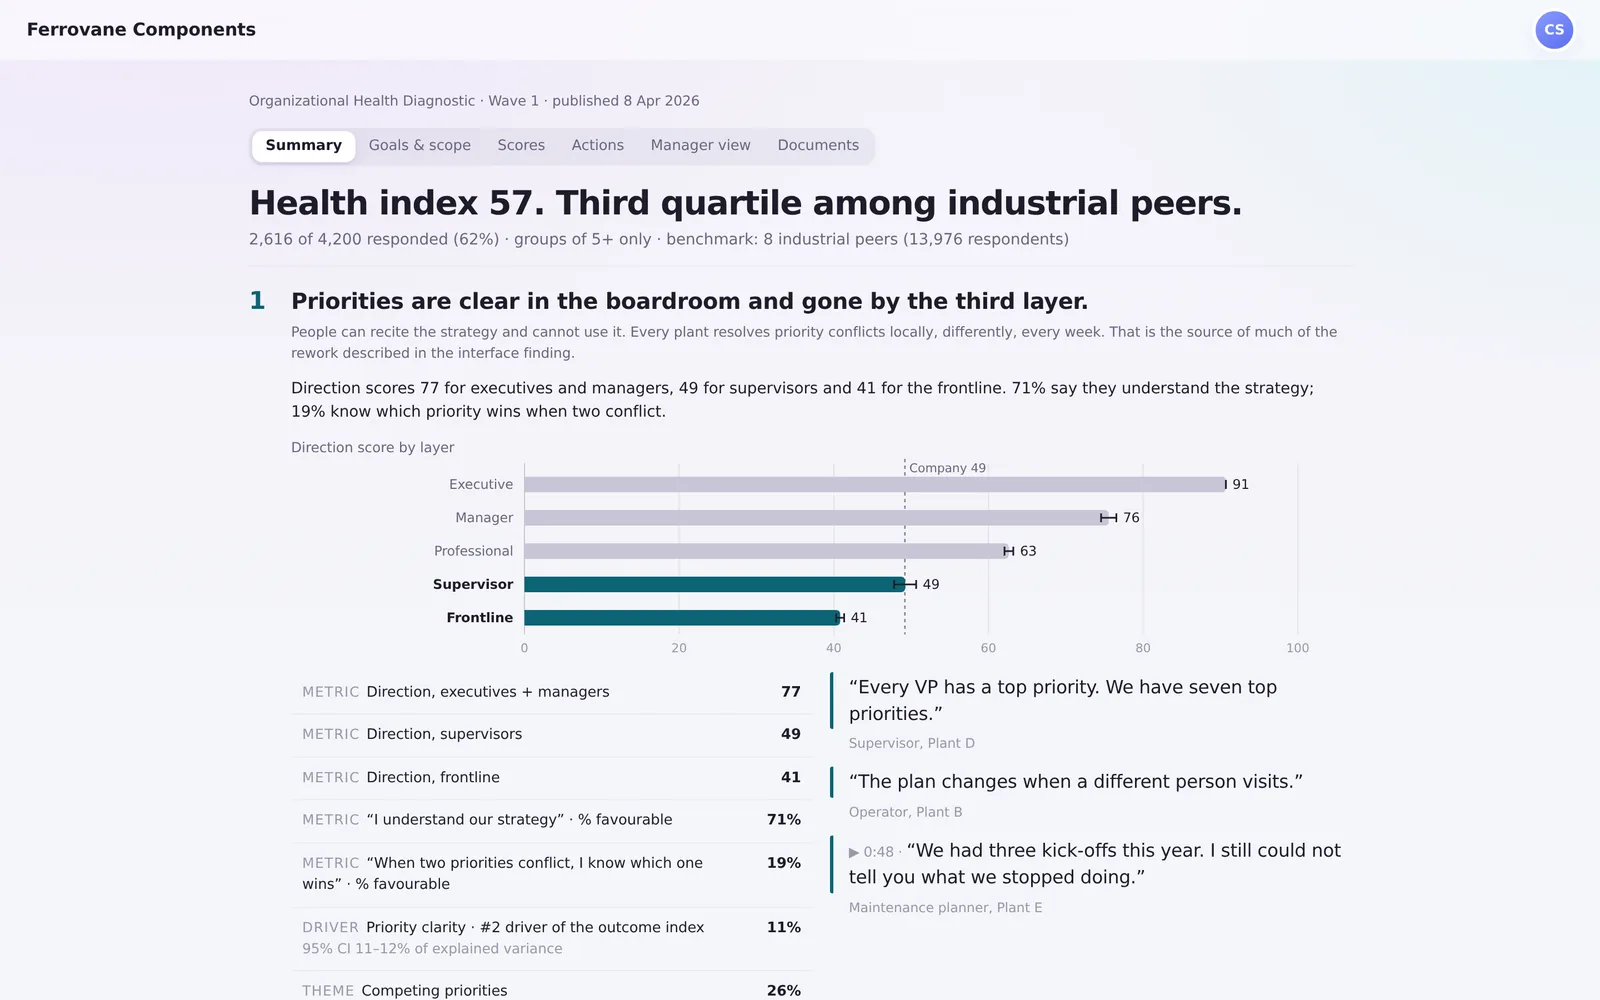
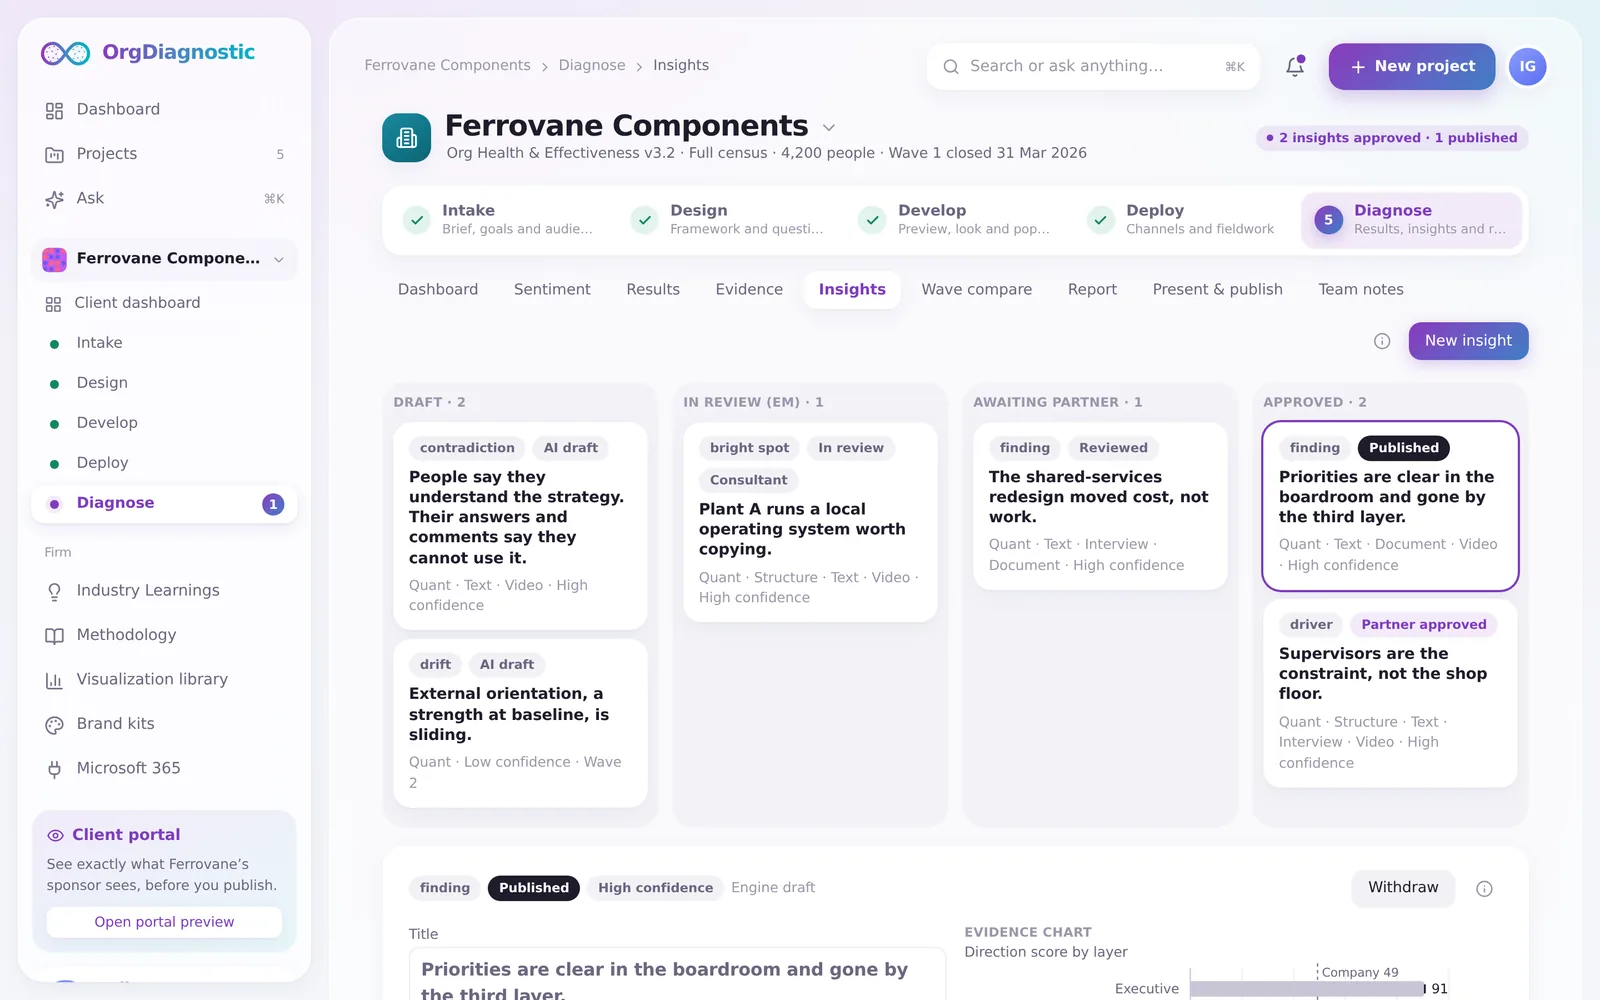
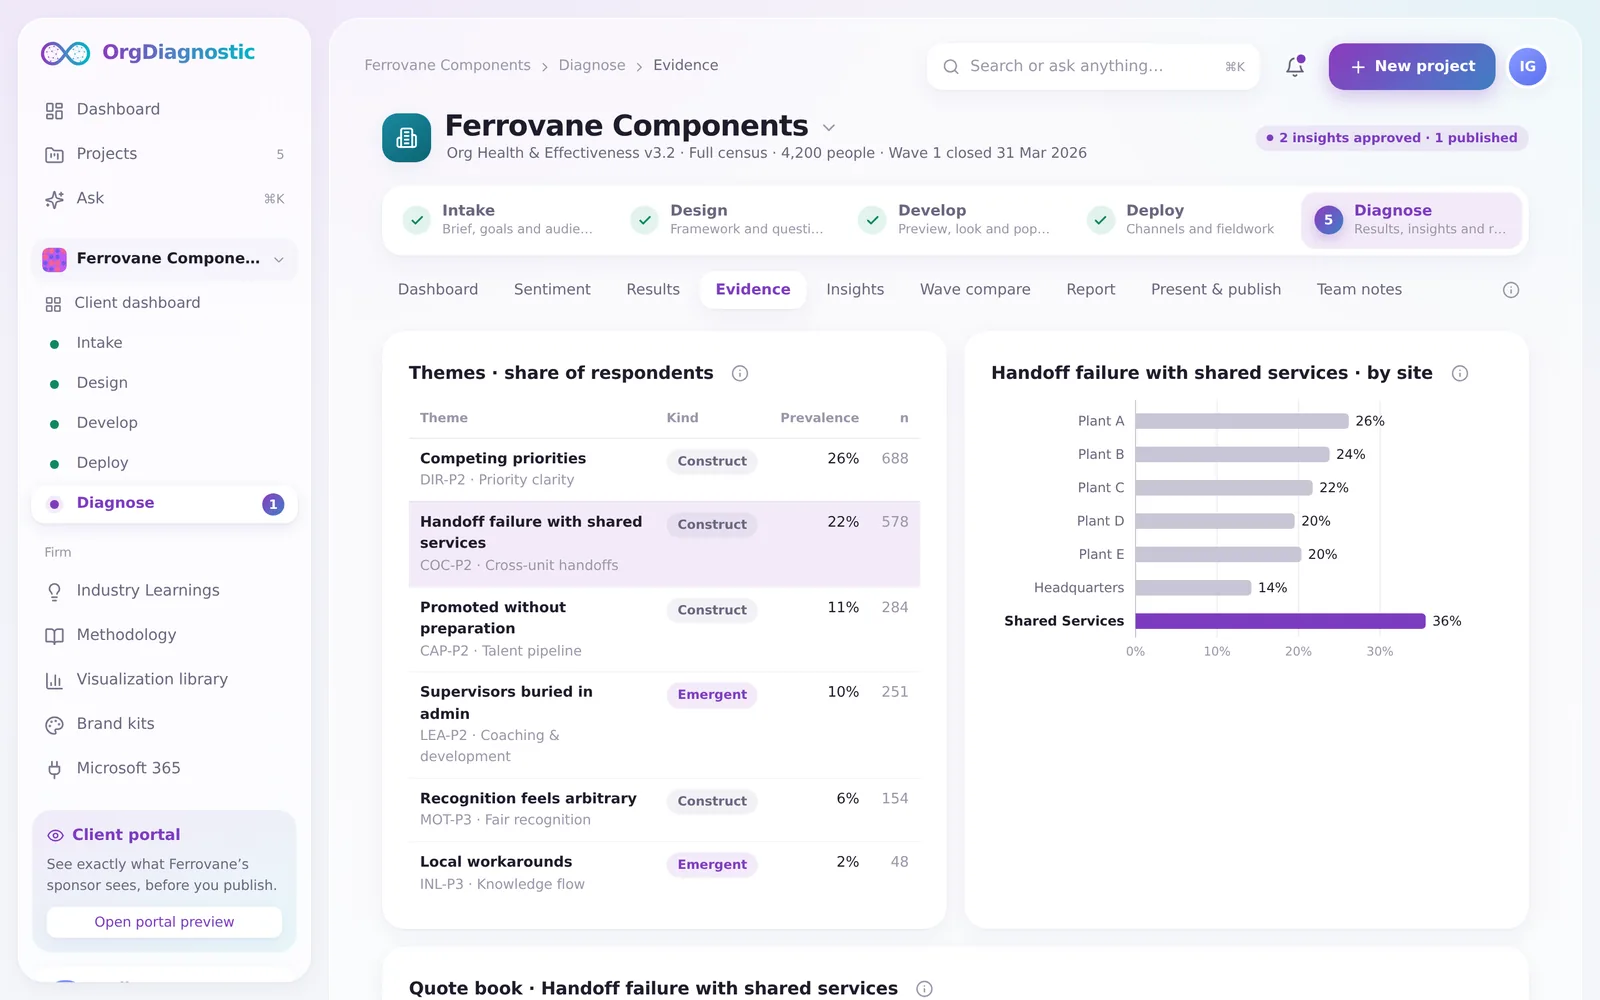
Each insight links its metric, theme and quote, passes a linter, and needs a partner's approval before a client sees it.
Thresholds, complementary and differencing suppression, in every chart, table and export.
Frameworks, weights and bands are yours. Every recommended move maps to one of your offerings.
Word, Excel, CSV, Forms or pasted text, matched question by question to your framework.
Write them at intake. The readout says which held up, and why.
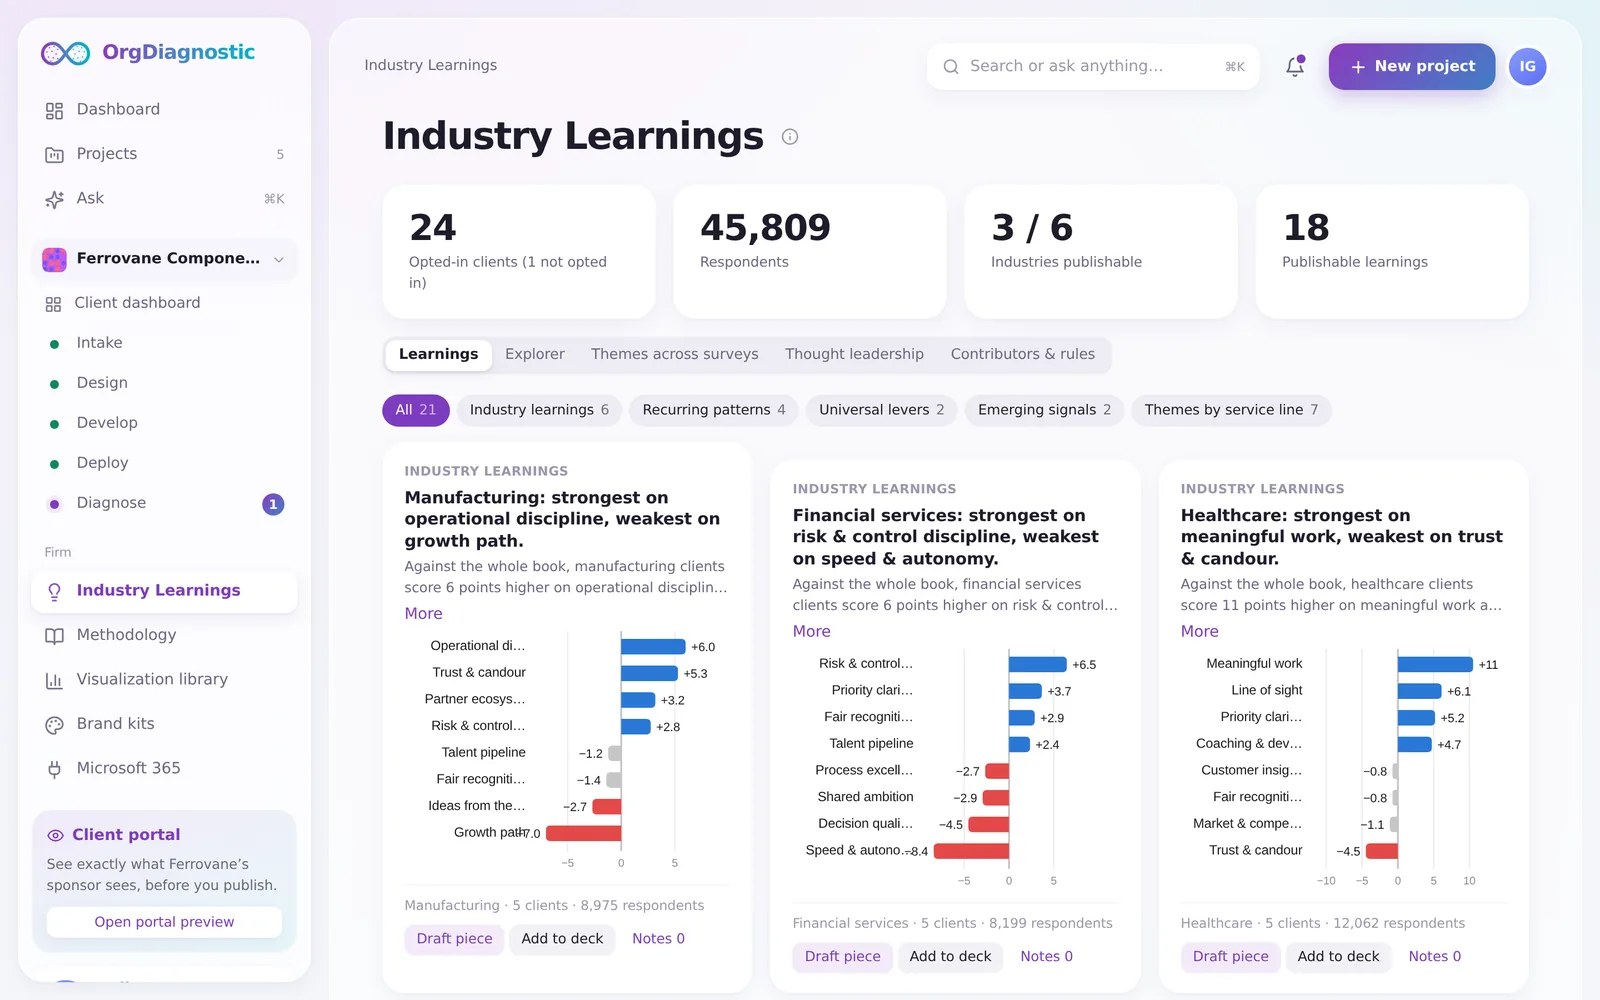
Opted-in, anonymity-safe results build a benchmark your firm owns. Industry Learnings turns it into thought leadership you can publish.
Ask in plain English. Every answer is calculated, with the numbers and the group size shown.
Co-branded per client, with no vendor name on any client screen or export.
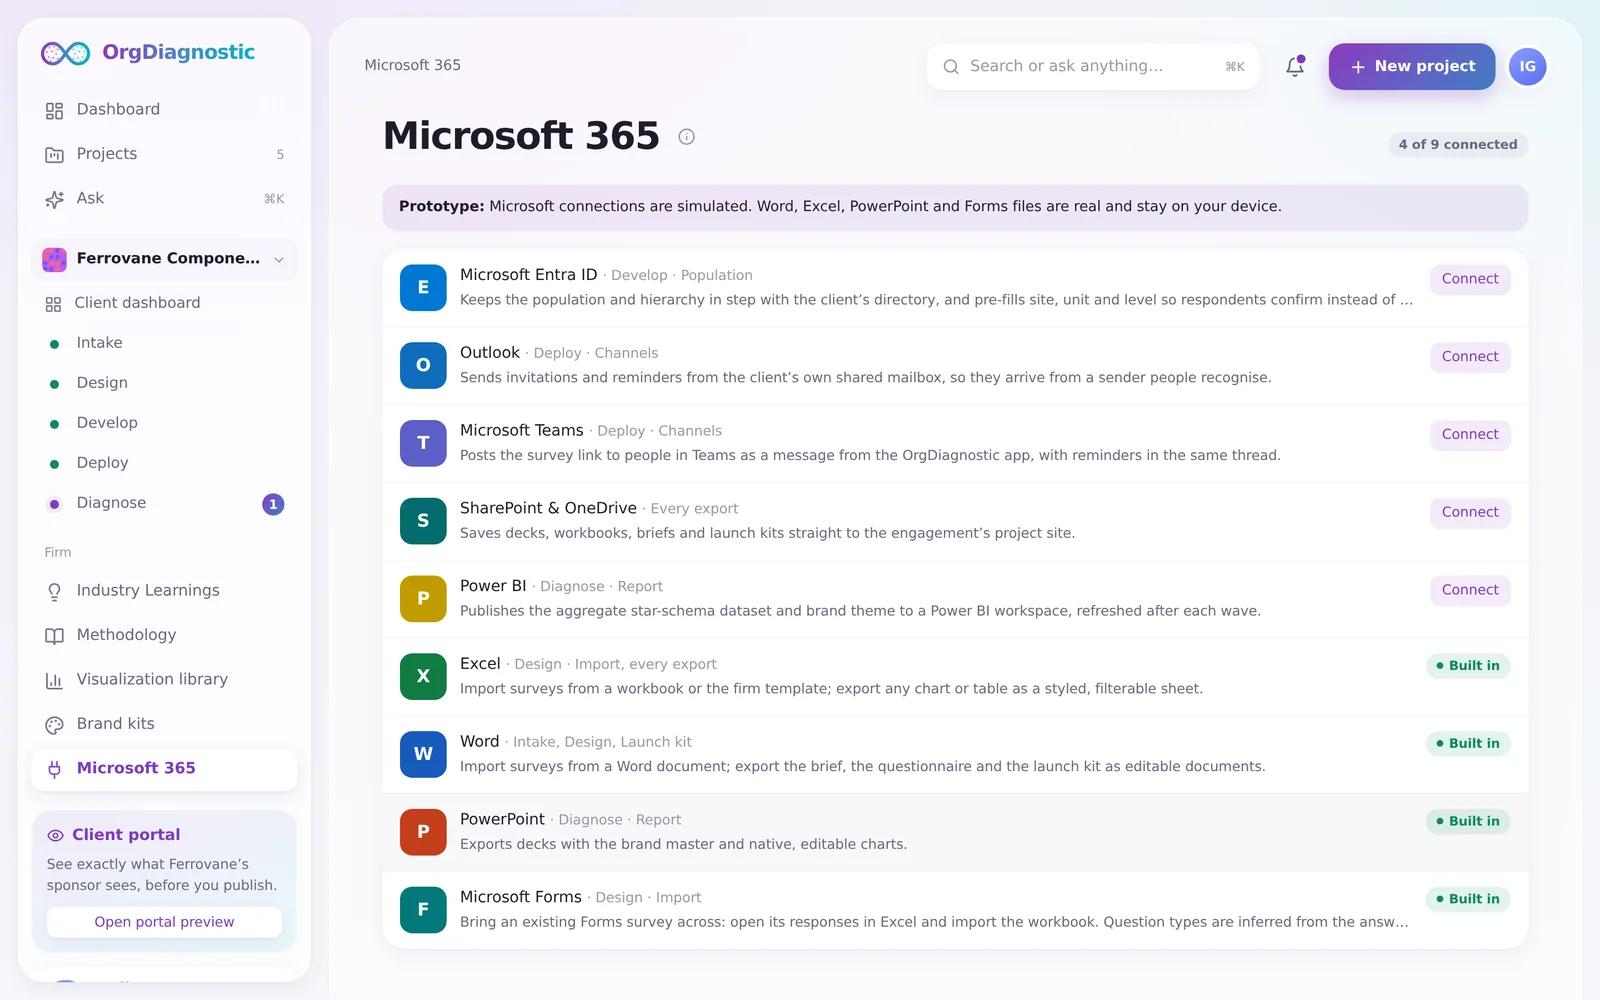
People from Entra ID, invites through Outlook and Teams, results out to Power BI and Office.
Connections are simulated in the prototype.
Org assessment
Emerging +4 vs peers
Emerging +3 vs peers
Emerging ±0 vs peers
Constraint −5 vs peers
For the firm

Why switch
| Capability | OrgDiagnostic | Employee survey platforms | Survey and form builders | Org design tools | Decks and spreadsheets |
|---|---|---|---|---|---|
| Brief to boardroom in one flow | Yes | No | No | No | By hand |
| Your own methodology, versioned | Yes | Partly | Questions only | No | By hand |
| Legacy surveys mapped to your framework | Yes | Partly | Import, no mapping | No | No |
| Contradictions across scores, comments and interviews | Yes | No | No | No | By hand |
| Evidence-linked insights with partner approval | Yes | No | No | No | By hand |
| Anonymity enforced in every export | Yes | In dashboards | No | No | No |
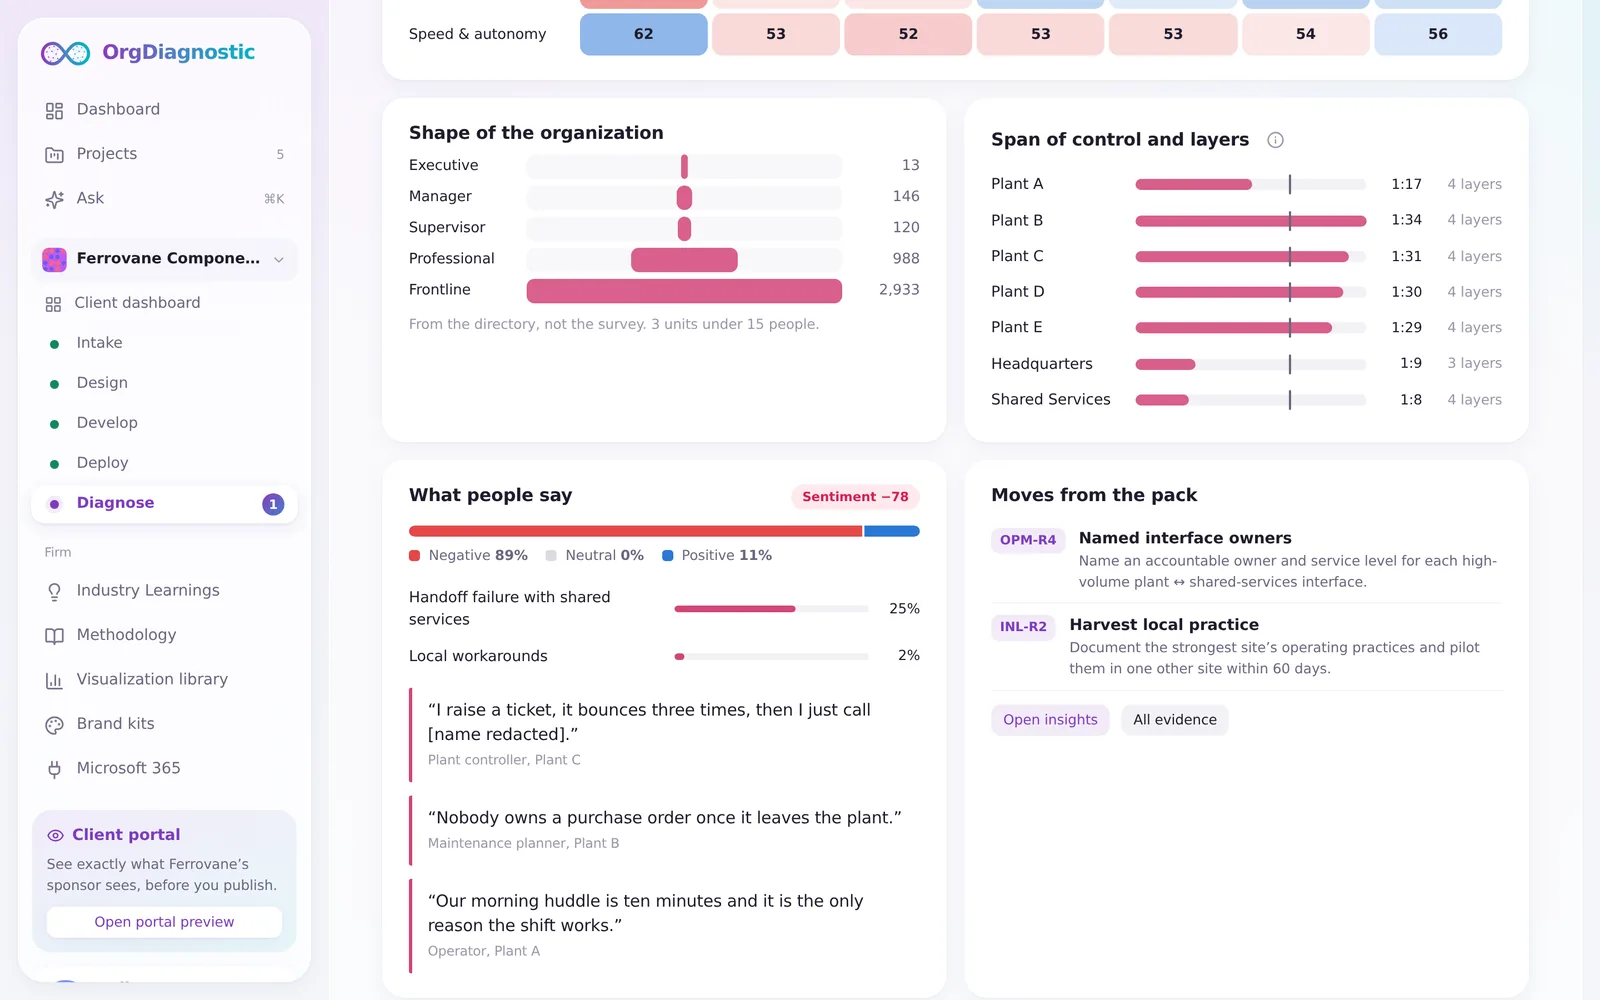
| Structure next to sentiment | Yes | No | No | Structure only | By hand |
| A benchmark your firm owns | Yes | Vendor's | No | No | No |
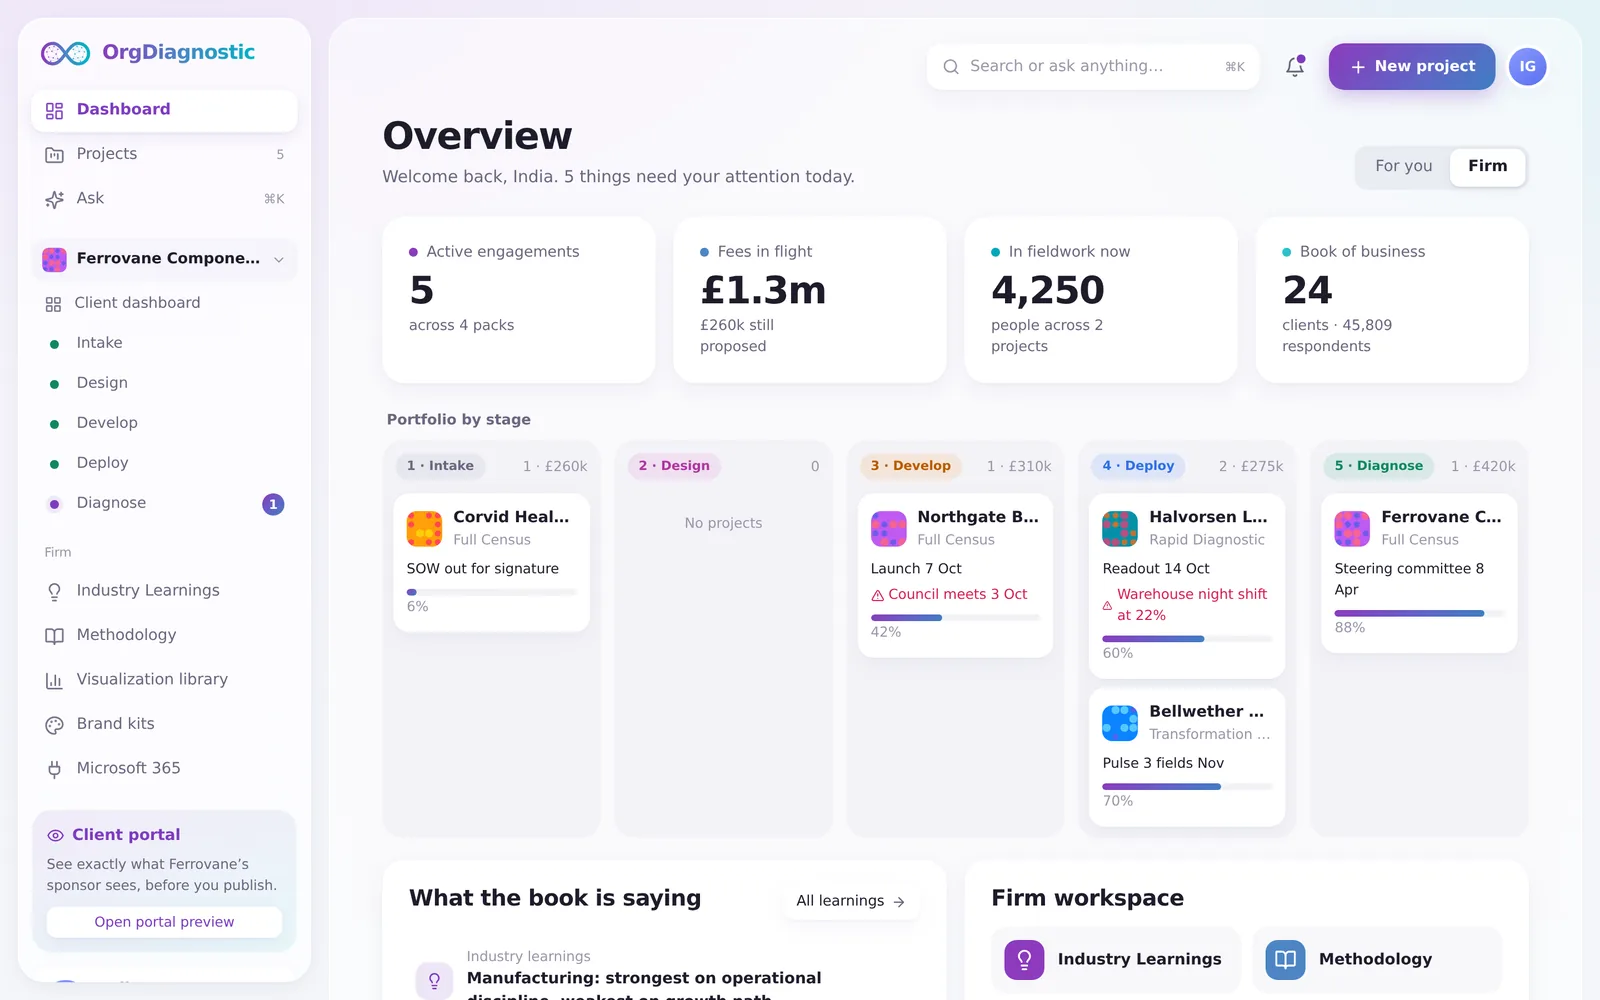
| Every client in one portfolio, by stage | Yes | No | No | No | No |
| White-label per client | Yes | Partly | Partly | No | Yes |
Typical capabilities by category, not a review of any specific product. Individual products vary.
Everything else
Trust
Every screen, chart and export goes through the same rules. Nobody can switch them off by accident.
The prototype runs in your browser with sample data. Microsoft 365 connections are simulated.