Explore the product.
See the capabilities.
Choose an area to inspect its features, actual product screens and visual examples. The complete diagnostic workflow stays connected.
Working prototype · fictional sample data · browser-local saving · simulated Microsoft 365 connections
Frame the client question. Prepare the research.
Open this workspace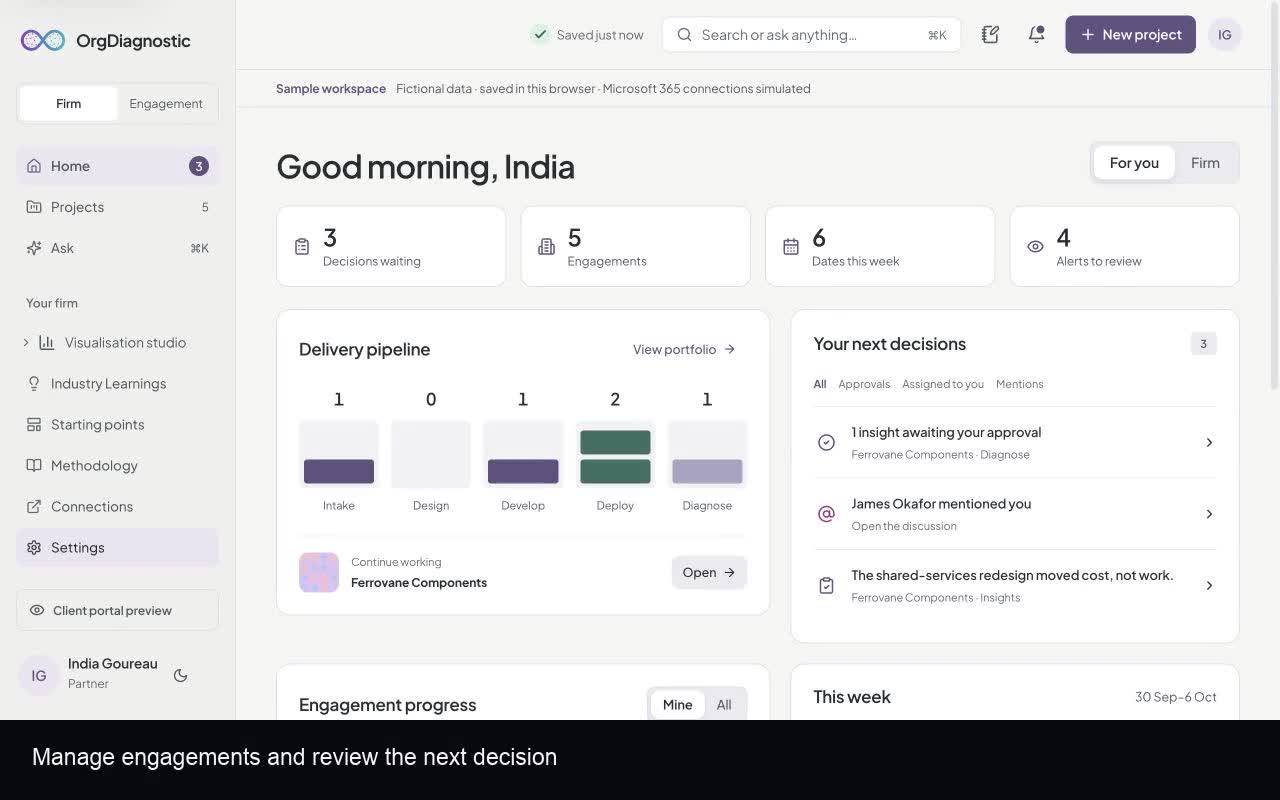
- Intake
- Capture the client context, goals, success measures and hypotheses. Keep the team aligned around one brief.
- Design
- Plan methods, adapt a framework, import existing questions and build the diagnostic around the brief.
- Develop
- Review the respondent experience, apply the engagement brand and simulate minimum-group rules before fieldwork.
Keep the evidence beside the finding.
Open this workspace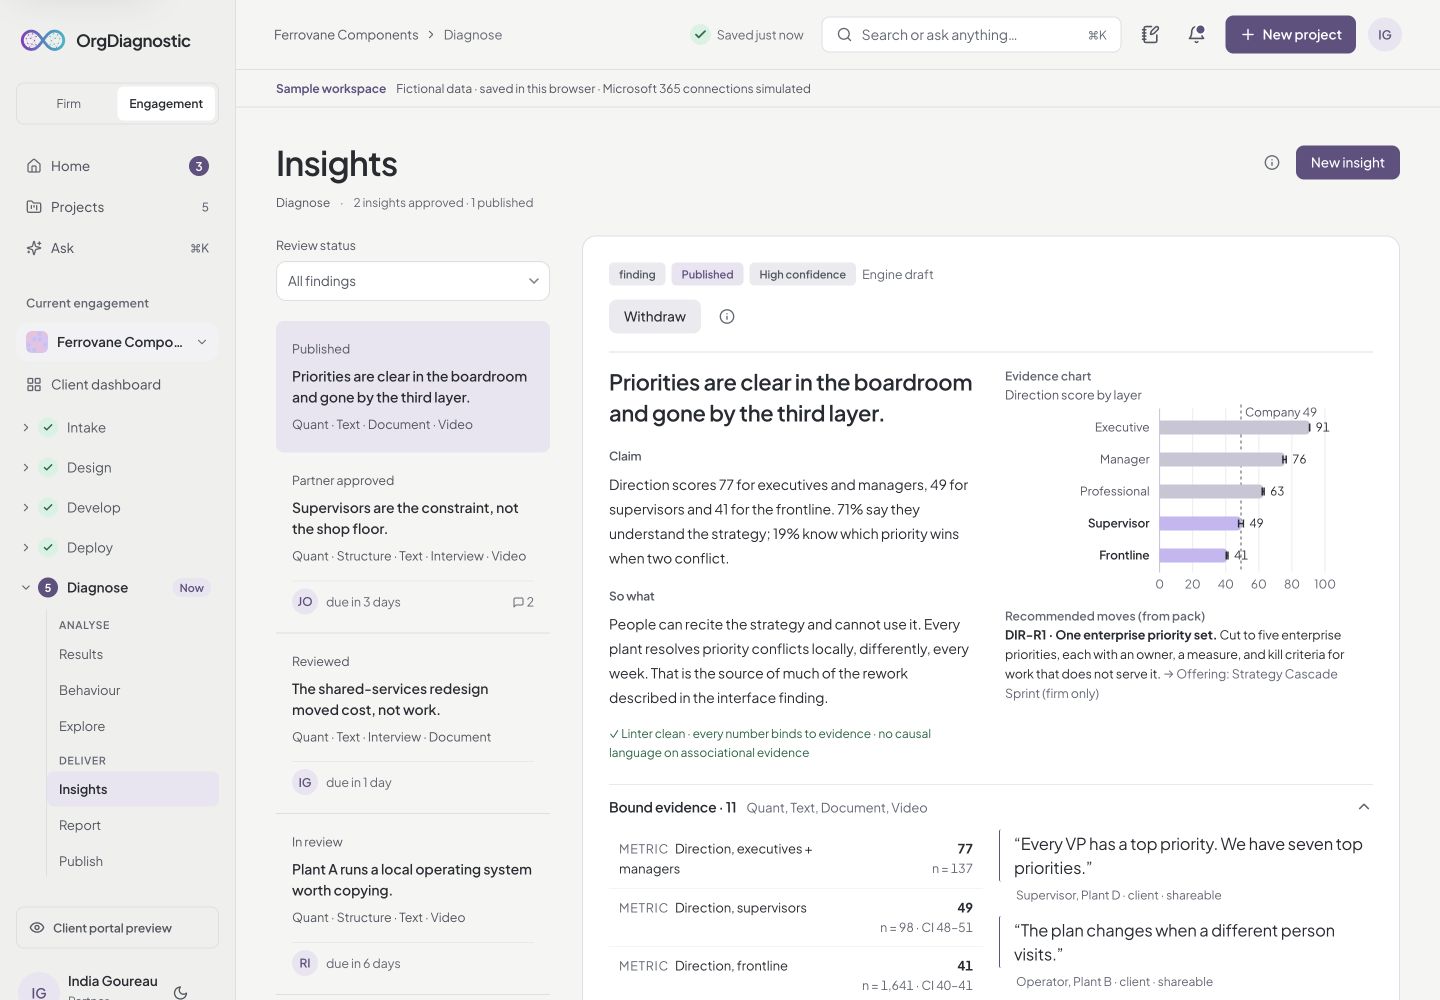
- Surveys and phone interviews
- Prepare questions, follow up on vague answers and track participation across collection channels.
- Interviews, focus groups and transcripts
- Review transcripts and coded themes alongside the quantitative findings.
- Triangulation
- Bring supporting and contradicting evidence from multiple methods into the same review.
See where to focus, and why.
Open this workspace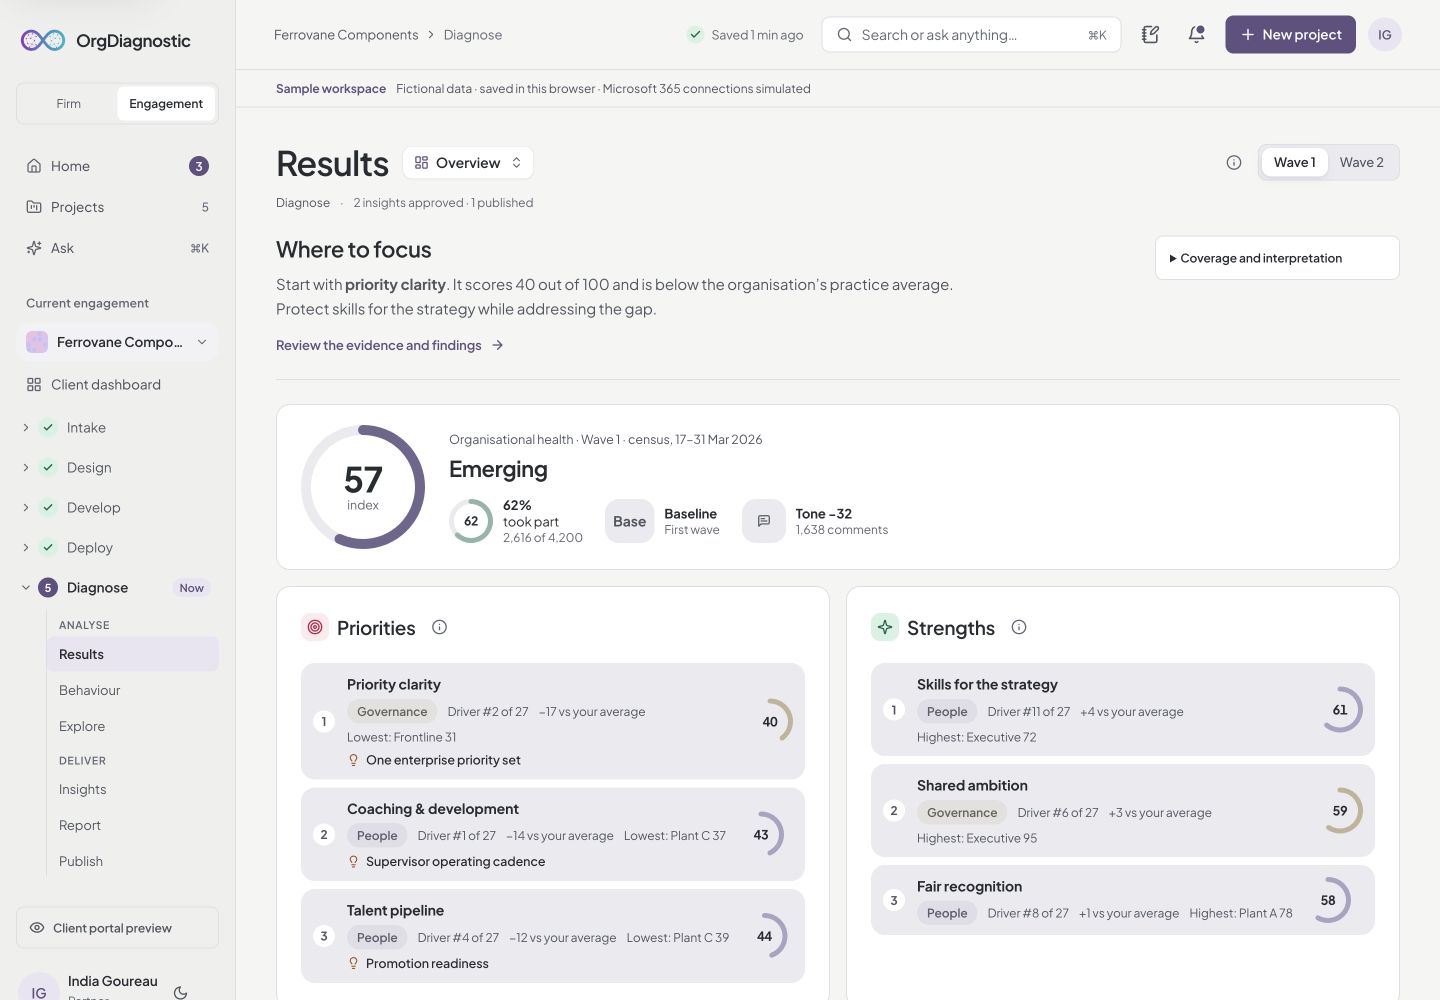
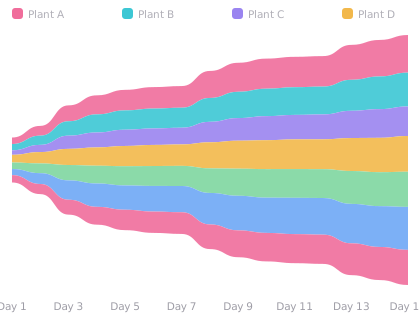
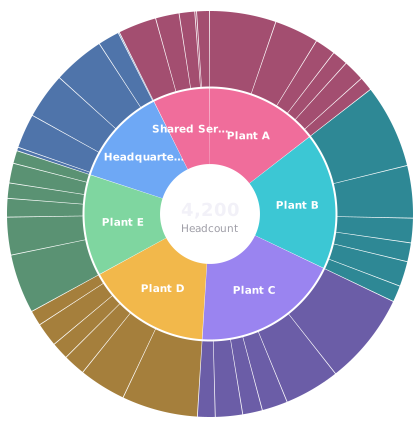
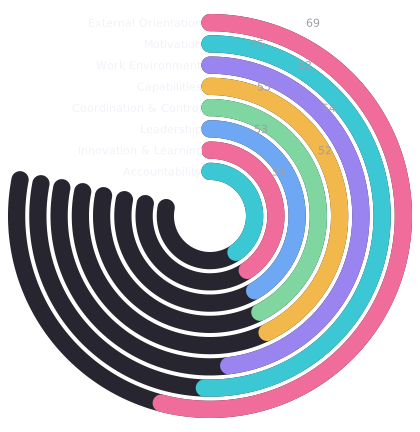
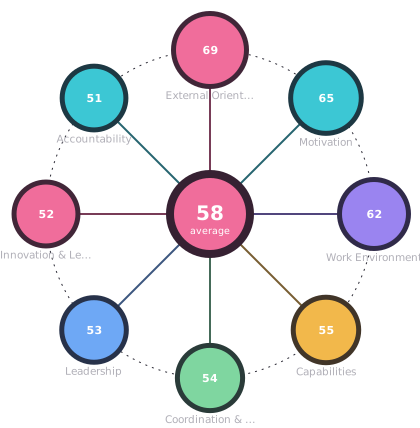
Original visualisation gallery · fictional chart examples
- Organisational health
- Explore People, Process, Governance and Structure. Separate priorities from strengths and inspect results by group and wave.
- Behaviour and sentiment
- Explore emotions, behavioural patterns and what people say alongside scores.
- Comparisons and benchmarks
- Compare cuts and waves. Keep external benchmark context separate from the client’s own results. The demo’s external benchmarks are illustrative, not a validated proprietary benchmark database.
- Evidence-linked findings
- Review claims with their sources. Move through draft, engagement review, partner approval and publication.
- Visualisation studio
- Create charts, tables and infographic views from the diagnostic data, with group-size suppression carried into views and exports.
Carry reviewed advice into the readout.
Open this workspace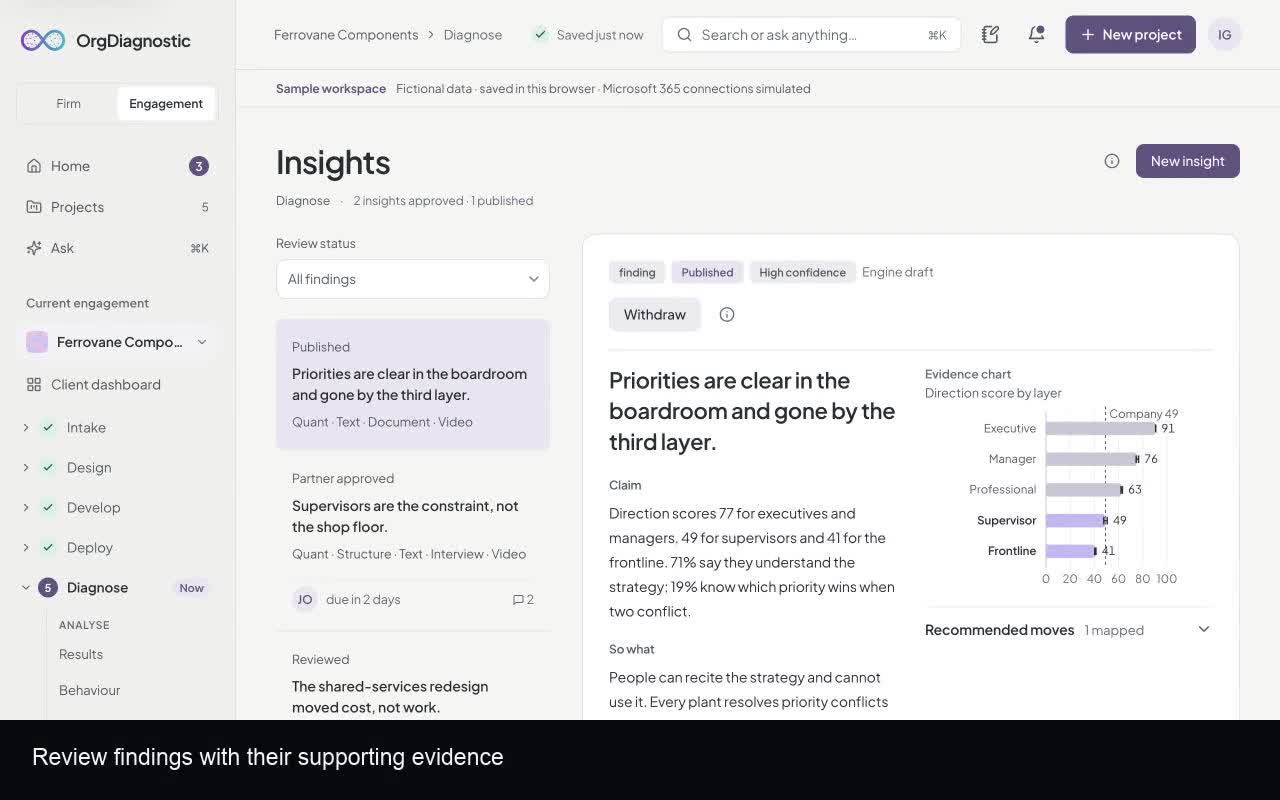
- Report workspace
- Arrange slides, refine commentary and apply the firm’s brand. Use a focused preview when presenting.
- Readout packs
- Prepare PowerPoint, PDF and spreadsheet exports from the engagement.
- Diagnostic room and client portal
- Publish partner-approved findings to the client portal. Sponsors see findings, scores, action plans and documents; managers receive an area-focused view. Approval alone does not publish a finding. Publishing a document freezes a copy of the deck.
- Privacy
- The prototype suppresses small groups and identifying cuts. Production deployment requires validating these rules across the complete collection and delivery flow.
Bring your methodology and your brand.
Open this workspace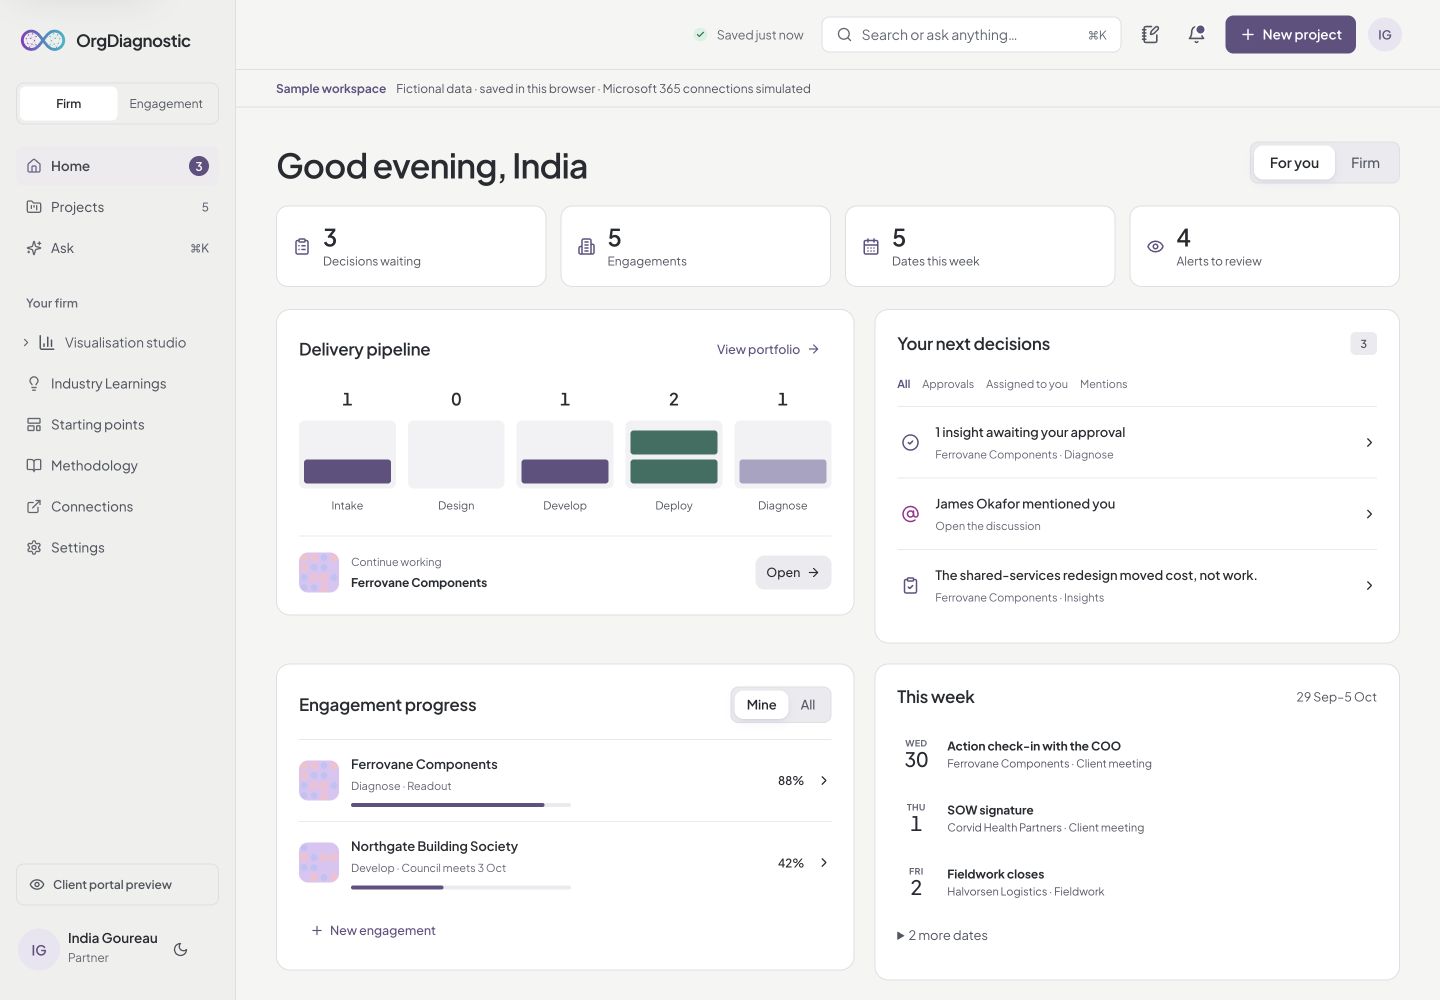
- Projects and firm view
- Keep the portfolio separate from the current engagement. See assignments, approvals and upcoming dates from Home.
- Frameworks, starting points and brand kits
- Reuse methodology and identity across engagements, including employee and customer experience starting points.
- Connections and collaboration
- Explore the simulated Microsoft 365 connections, assignments, discussions and version history.
See the features in motion.
Four captioned tours cover diagnostics, analysis, delivery and the client experience.
Watch the product tours